██████╗  ██████╗  ██████╗ ██████╗
██╔══██╗██╔════╝ ██╔═══██╗██╔══██╗
██║  ██║██║  ███╗██║   ██║██████╔╝
██║  ██║██║   ██║██║   ██║██╔═══╝
██████╔╝╚██████╔╝╚██████╔╝██║
╚═════╝  ╚═════╝  ╚═════╝ ╚═╝
DGOP Usage
API Usage
The dgop API provides a documentation endpoint, with a full openapi 3.1 specification available at http://localhost:63484/docs

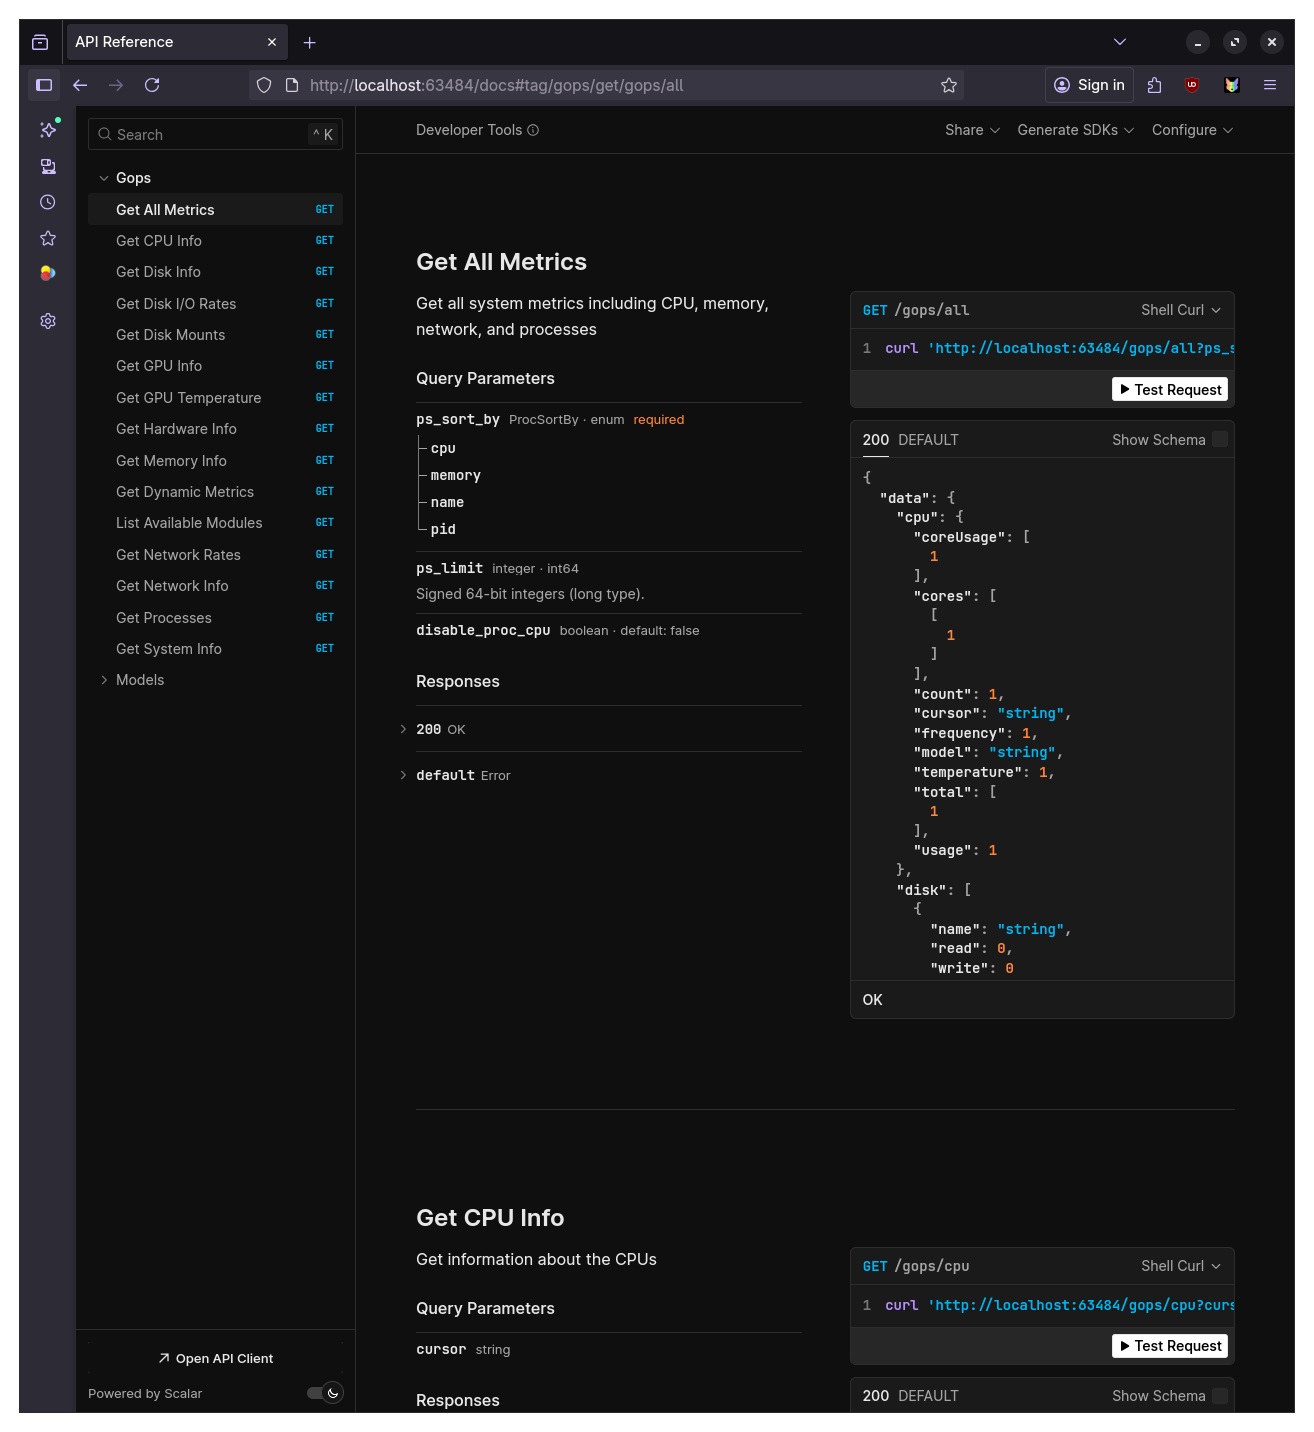
It is guaranteed to be up to date so it's the best way to reference API usage.
CLI Usage
DGOP provides a comprehensive command-line interface for querying system metrics. All commands support JSON output via the --json flag for easy integration with scripts and applications.
Basic Commands
Get quick system information using individual commands:
# View CPU usage and information
dgop cpu

# Check memory usage
dgop memory

# Monitor network interfaces
dgop network

# View disk information
dgop disk

# List running processes
dgop processes

# Get general system information
dgop system
Advanced Commands
For more specialized monitoring:
# Monitor disk I/O rates in real-time
dgop disk-rate

# Track network transfer rates
dgop net-rate

# View GPU information
dgop gpu

# Get GPU temperature readings
dgop gpu-temp

# Display hardware details (motherboard, BIOS)
dgop hardware

# Get all metrics at once
dgop all
Process Management
The processes command provides detailed process information with sorting and filtering options:
# List top processes by CPU usage
dgop processes --sort cpu --limit 20

# List processes by memory usage
dgop processes --sort memory --limit 10

# Disable CPU calculation for faster listing
dgop processes --no-cpu
Meta Command
The meta command is designed for efficient polling by requesting multiple modules in a single call:
# Query multiple metrics at once
dgop meta --modules cpu,memory,network

# Get all metrics with specific GPU monitoring
dgop meta --modules all --gpu-pci-ids 0000:01:00.0

# Efficient CPU monitoring with cursor-based sampling
dgop meta --modules cpu --cpu-cursor <previous-cursor>

# Process monitoring with cursor for accurate percentages
dgop meta --modules processes --proc-cursor <previous-cursor> --limit 100
Cursor-Based Sampling
For accurate CPU and process metrics over time, DGOP supports cursor-based sampling. The meta command returns cursor values that should be passed back on subsequent calls:
# First call - no cursor needed
dgop meta --modules cpu,processes --json

# Subsequent calls - use returned cursors for accurate deltas
dgop meta --modules cpu,processes --cpu-cursor abc123 --proc-cursor def456 --json
This ensures CPU percentages reflect actual usage between samples rather than system-wide averages.
Interactive Monitor
Launch a real-time, interactive system monitor, similar to top, htop:
dgop
API Server
Start the HTTP API server for programmatic access:
# Start server on default port (63484)
dgop server

# Access OpenAPI documentation at http://localhost:63484/docs
Output Formats
All commands support JSON output for integration with other tools:
# Get CPU info in JSON format
dgop cpu --json

# Pipe to jq for parsing
dgop memory --json | jq '.usage'
Common Flags
--json- Output results in JSON format--no-cpu- Disable CPU calculation in process listing for better performance--help- Show help for any command
List Available Modules
See which metric modules are available:
dgop modules